Like most students, Efren Chavez was looking for an easy A when he chose to take geology this semester.
"I chose geology because I thought it would be easier than chemistry," said Chavez, a 20-year-old business administration major at Gainesville State College.
"I thought we were just going to be learning about a bunch of rocks and minerals."
That was partially true. The course also required him to read maps. His easy A had just become difficult.
Chavez can’t read a map. In fact, he can’t even see a map.
He lost his sight when he was just 9 years old, a result of detached retinas.
"Part of the geography and geology classes at GSC involve reading and interpreting topographic maps. These are two-dimensional maps that use various symbols and lines to depict elevation and other geographic features," said Chris Semerjian, Gainesville State associate professor of geography.
Ordinarily, visually impaired students would’ve been referred to a three-dimensional model to use, but Chavez didn’t want to be singled out. He wanted to learn in the same manner as his peers.
"This was the first time that we’ve been given the challenge of how to teach a visually impaired student to read a flat map on a piece of paper," Semerjian said.
Chavez’s desires may have presented the college with a challenge, but has proven to not be an insurmountable obstacle.
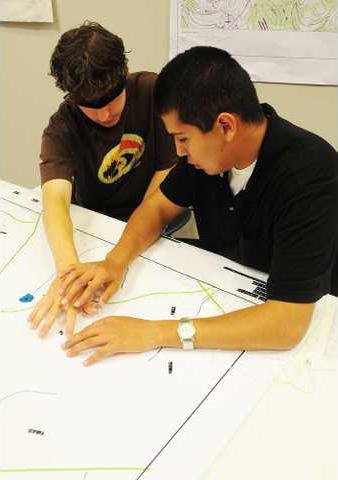
With assistance from Chavez, staff member Carol Kraemer developed a unique paper map that allows him to "read" it. To those with sight, aside from the raised blue and green lines indicating roads and rivers, the map appears to be blank.
"We made something he could feel, instead of see," said Kraemer, a Gainesville State geospatial technology research associate.
"We don’t know that anything like this has ever been done before."
To create the map, Kraemer used Adobe Photoshop to make a mirror image of a digital map, which she then enlarged and printed.
"I made a mirror image because we needed to be able to see the lines as he would, so that we could trace them with the graphic tactile tools," Kraemer said.
"Those tools create texture on the other side, so he can feel the features of the map. I tried to get as close as I could to what the other students saw when they look at their topographical maps.
"I had to split his into two. One has coordinates on it and the other has (land features) because having all of that information on one would’ve been confusing."
Chavez’s nimble fingers glide over the dots, dashes and ridges on the paper. He easily identifies roads and rivers, while differentiating between the incline and decline of a mountain.
He picks up on subtle changes that his sighted-counterparts miss.
"I put on a blindfold and tried to pick things out, but my hands didn’t see as well as my eyes did," said Derek Robinson, a Gainesville State environmental science major, who helped create the map.
"I’m really impressed the way he has picked all of this up. Our sight sometimes gets in the way of our learning, but he doesn’t have that issue.
"It’s a different way of learning, but we’re learning the same thing."
Last week, the Geospatial Alliance hosted Geographic Information Systems, or GIS Day, at Gainesville State. During the event, GIS users shared real-world applications for the multidimensional technology.
According to the United States Geological Survey, GIS "is a computer system capable of capturing, storing, analyzing, and displaying data identified according to location."
With GIS technology, users can create multilayered maps — very much like the paper maps that Chavez uses. During GIS Day, Chavez showed visitors how to "read" his maps.
"You’re going to feel a lot of different lines. Did you notice that thick line? That’s the road," Chavez told one, blindfolded volunteer.
"And those little curved ones are called contour lines. They basically indicate the level of steepness in an area. The closer the lines are, the steeper it is."
Although he didn’t physically create the maps, Chavez was a key member of the team.
"He helped me through it every step of the way. I would do a little bit at a time and have him check it to make sure I was on the right track," Kraemer said.
"He even taught me how to use Braille, so I could make the stickers for it."
Even though Kraemer was creating a learning tool for Efren, he taught her the importance of seeing things from a different perspective.
"During the design process, I thought about not going with the green roadway because I didn’t like the way it looked," Kraemer said.
"When I told Efren that I was going to do it over, he started feeling the map and said, ‘Don’t change a thing. I can read it great.’
"I almost let my sight get in the way of me seeing that things were as they
should be."
This may be the first map of its kind, but it has inspired the Gainesville State team to make sure it’s not the last.
"This is the prototype. We’re very excited about how successful this first attempt has been," Semerjian said.
"(Chavez) used this map to take a lab test and he made a 100, which is highly unusual for students who can see. It’s a real testament not only to what (Kraemer) has created, but also his ability to see through his hands.
"We hope to replicate this method, so we can not only help other visually impaired students on our campus, but also across the country."
For Chavez, who uses a guide dog to help him navigate around the Oakwood campus, being able to learn the course materials on his own has been a treat.
"At first, I was kind of overwhelmed because it is a lot of information to process," Chavez said.
"In the beginning, I let my hands wander over the map so I could visualize where everything was. Once I learned how it looked, it became easier.
"Being able to see what everyone else sees has been nice."

